Chart of Average Historic Rainfall in Texas
Understanding the historic rainfall patterns in Texas is crucial for homeowners, landscapers, and irrigation professionals. This chart provides the average monthly rainfall in inches for various cities across the state. By referencing this data, you can make informed decisions about watering schedules, irrigation setup, and plant choices.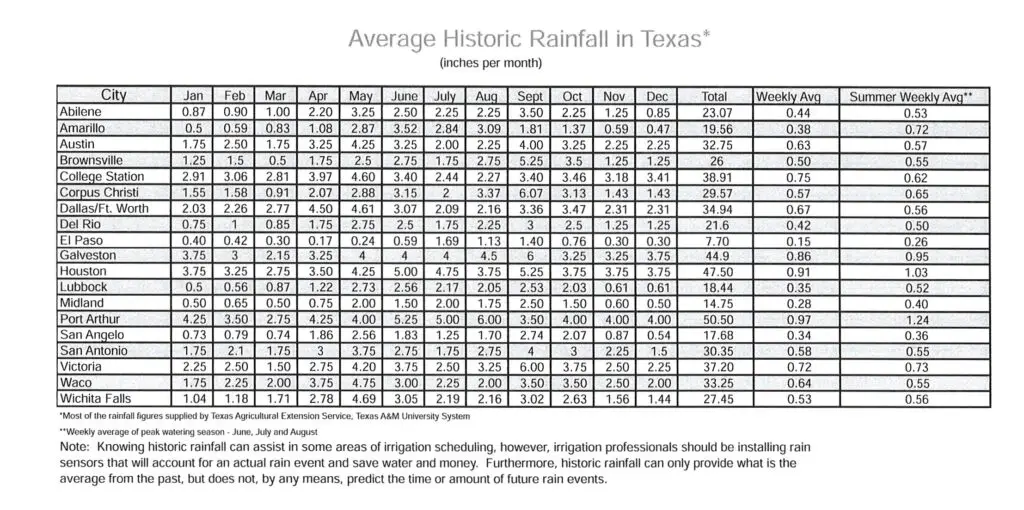
How to Use This Chart
- Determine Your City’s Averages: Locate your city in the chart to understand the typical monthly rainfall patterns. For example, if you live in Houston, you’ll notice that June tends to have the highest rainfall at 5.25 inches, while February averages only 3.5 inches.
- Plan Your Watering Schedule: Use the chart to identify months with lower rainfall and adjust your watering schedule accordingly. For example, in dryer months like August or January, your lawn or garden may require more supplemental watering.
- Set Up Smart Irrigation Systems: If you have a smart irrigation system, like a Hydrawise timer, this chart can help you program predictive watering settings. Such systems can sync with local weather stations and automatically adjust based on rainfall trends.
- Monitor Seasonal Trends: Compare the summer weekly averages to the rest of the year. Summer often requires careful monitoring of irrigation due to higher temperatures and faster evaporation rates.
FAQs About the Historic Rainfall Chart
1. Why is this chart important for irrigation planning?
The chart provides average rainfall data, which helps you estimate how much supplemental water your lawn, garden, or crops may need. Proper planning reduces water waste and keeps plants healthy.
2. Can I rely solely on this chart for watering?
While the chart is a great baseline, it’s important to also account for current weather conditions, soil moisture levels, and plant needs. Pair this chart with a rain sensor or weather station for the best results.
3. Why is there such a variation in rainfall between cities?
Texas is geographically diverse, with coastal areas receiving significantly more rain than inland or desert regions. For instance, Houston averages over 49 inches annually, while El Paso sees just 7.10 inches.
4. Does this chart account for future rainfall patterns?
No, this chart provides historic averages and cannot predict future rain events. However, it’s still a valuable tool for understanding long-term trends and planning accordingly.
5. How do I adjust for sudden changes in rainfall?
Consider using a rain sensor or manually turning off your irrigation system when there’s unexpected rainfall. Smart irrigation systems can also help manage this automatically.