Lawn Sense

Sprinkler Repair in Dallas, TX

  • Services
    • Sprinklers & Irrigation
      • Sprinkler System Installation
      • Sprinkler Repair
      • Sprinkler Head Repair
      • Fault Locating
      • Sprinkler Inspection
      • Sprinkler Leak Detection
      • Sprinkler Winterization
      • Backflow Repair
    • Lawn Care
      • Lawn Fertilization
      • Weed Control
      • Pre-Emergent Treatment
      • Lawn Pest Removal
      • Lawn Disease Treatment
    • Outdoor Lighting Installation
  • About
    • Why You Should Choose Lawn Sense
    • Maintenance Plans
    • Watering Cost Calculator
    • Lawn and Sprinkler Tips
    • Careers
  • Referral Program
    • Log In
    • Sign Up
  • (972) 529-8423
  • Get Service

Spray Head Performance Charts

Spray Head Performance Charts

The “Spray Head Performance Charts” page provides essential information to help you calculate the Gallons Per Minute (GPM) for your pop-up spray heads, giving you a clear baseline for your irrigation system’s water usage.

To ensure accurate results, it’s critical to verify that all spray heads in a zone have a matched precipitation rate, which can be achieved by using nozzles from the same manufacturer, such as RainBird or Hunter. Manufacturer-specific nozzle charts are a valuable resource, offering precise data for different nozzle lines.

This guide empowers you to optimize your irrigation setup for even and efficient water distribution.

Spray head performance chart based on nozzle size

How to Use the Spray Head Performance Chart

  1. Identify the Spray Nozzle Series: Select the spray nozzle series based on the radius of coverage needed (e.g., 5-foot, 8-foot, or 15-foot). This information is typically marked on the nozzle or available in the manufacturer’s documentation.
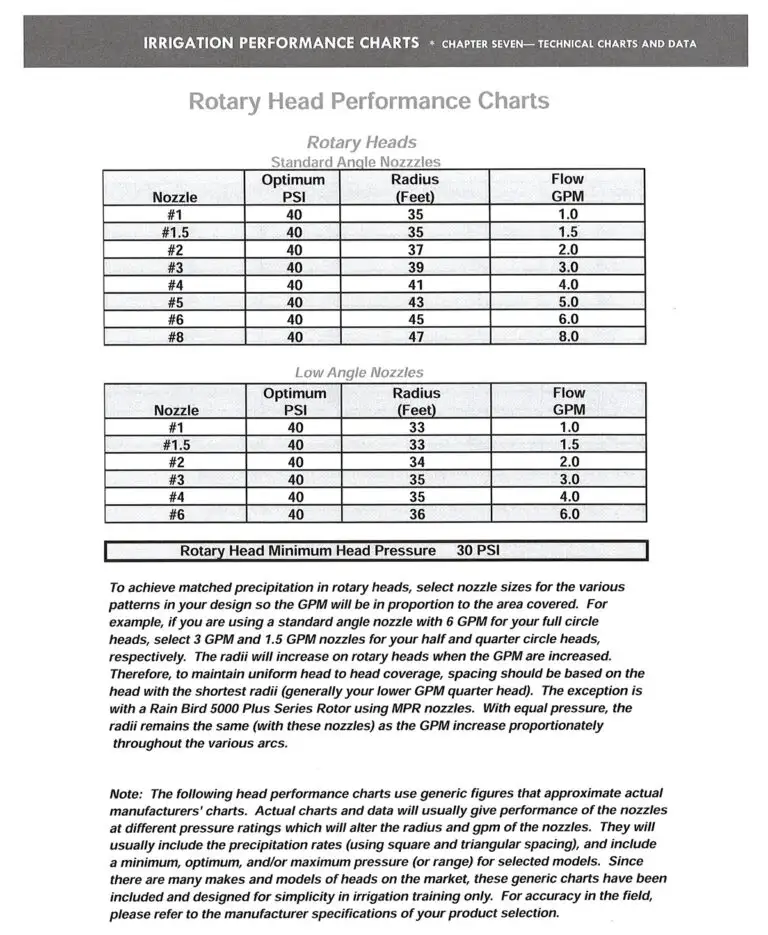
  2. Determine Optimal Pressure (PSI): Check the chart for the recommended operating pressure (usually 30 PSI for most spray nozzles) to ensure proper function and water distribution.
  3. Measure the Radius of Coverage: Match the desired spray radius to the corresponding nozzle in the chart. This ensures that the spray head delivers water to the intended area without overshooting.
  4. Calculate GPM Flow Rate: Find the GPM for the selected nozzle and radius under the optimal PSI. This value represents the water flow rate for one spray head.
  5. Account for Matched Precipitation Rate: Ensure all nozzles in the zone are from the same manufacturer and nozzle line to maintain a matched precipitation rate, meaning the entire zone receives uniform water distribution.
  6. Determine Total GPM for the Zone: Multiply the GPM of a single spray head by the total number of spray heads in the irrigation zone. This helps in selecting the right pipe size and pressure regulator for the system.

FAQs About Spray Head Performance Charts

1. What is a matched precipitation rate, and why is it important?
Matched precipitation rate means all nozzles in the zone deliver water at the same rate, regardless of their spray radius or arc. This ensures even watering across the landscape, preventing dry spots or water pooling.

2. Can I mix nozzles from different manufacturers in the same zone?
No. Mixing nozzles from different manufacturers can result in mismatched precipitation rates and uneven water distribution. Stick to nozzles from the same brand and nozzle line.

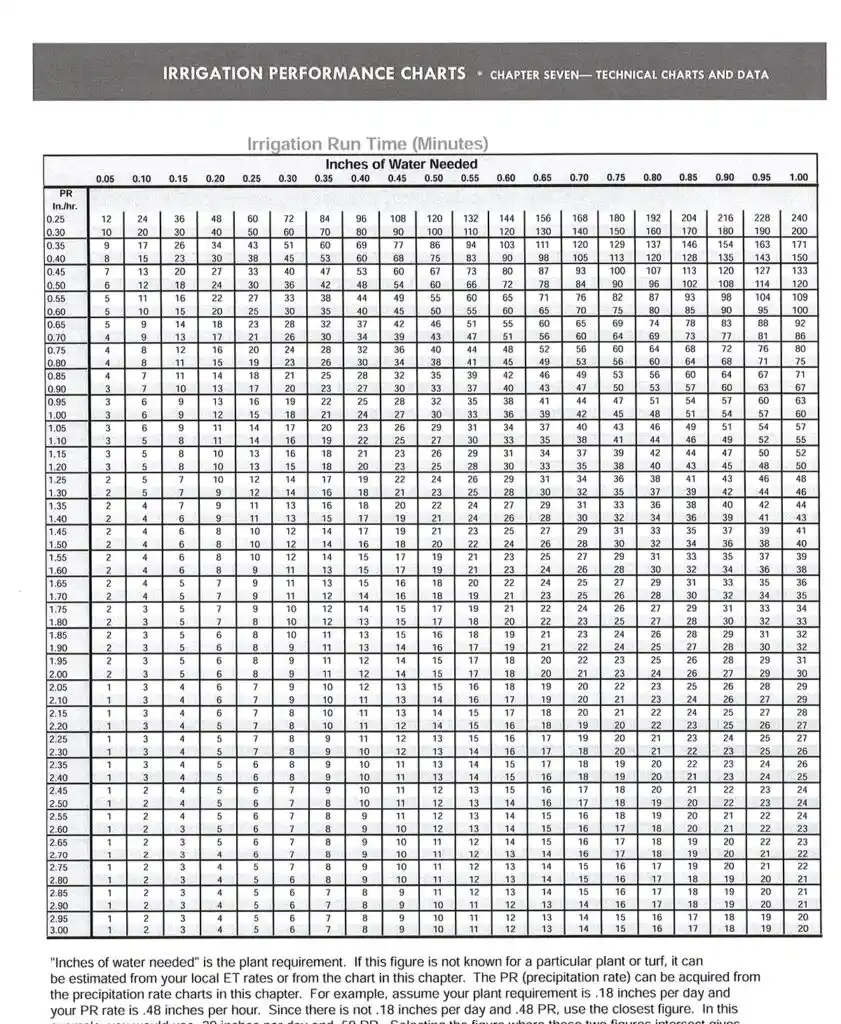
3. How do I calculate the precipitation rate (PR) for my zone?
Use the formula: PR = (96.3×Total GPM)/Zone Area in Square Feet​

This gives you the precipitation rate in inches per hour, which is crucial for scheduling run times.

4. What do I do if my system has inconsistent pressure?
Install a pressure regulator to ensure consistent pressure across the system. Inconsistent pressure can cause uneven spray patterns and reduce the efficiency of your irrigation.

5. How often should I inspect my spray heads?
Inspect your spray heads monthly during the irrigation season to check for clogs, leaks, or misaligned nozzles. Regular maintenance ensures optimal performance.

6. Can spray heads work on sloped areas?
Yes, but use pressure-regulated heads and check valves to prevent water from pooling at the base of the slope. Adjust nozzle settings to account for elevation changes.

7. What do the strip nozzles in the chart cover?
Strip nozzles are designed for narrow, rectangular areas such as medians or flower beds. Their dimensions (e.g., 4×15 or 4×30) indicate the width and length of coverage.

Additional Tips for Spray Head Performance

  • Test Coverage Before Final Installation: Temporarily install spray heads and run the system to check for uniform coverage and make adjustments as needed.
  • Adjust Arc and Radius Settings: Many spray nozzles allow adjustments to the arc and radius to tailor coverage to your specific landscape.
  • Maintain Clean Nozzles: Dirt and debris can clog spray heads, leading to uneven watering. Remove and clean nozzles regularly to maintain performance.
  • Account for Wind Conditions: In windy areas, use low-angle nozzles to minimize spray drift and ensure water reaches the intended target.
  • Upgrade to High-Efficiency Nozzles: Consider nozzles designed to reduce water runoff and increase efficiency, especially in areas with water restrictions.

By leveraging the Spray Head Performance Chart and adhering to best practices for irrigation system design and maintenance, you can achieve optimal water use and a thriving landscape. For more detailed calculations or specific system requirements, consult an irrigation professional.

Filed Under: Charts - Homeowner Lawn Care & Sprinklers

Soil Infiltration Rate Chart

Soil Infiltration Rate Chart

Use this chart to determine how much you can water at one time. The numbers are Inches Per Hour.

The first thing to know is that in DFW we have clay soil. The infiltration rate for clay soil is 0.13 inches of water per hour on flat ground. On a 12% slope that decreases to 0.05 inches of water per hour. To put that in perspective a 45° slope is a 100% slope, a 10% slope is 5.71°.

Clay soil has the greatest horizontal movement of water of all soil types.

This means watering for 10+ minutes is a waste of water because our clay soil simply cannot accept it. Even if you have flat ground, the water will sit on top. Which results in mosquitos and weed patches, not green grass.

The key takeaway is not to water once a day for long time. Water multiple times per day for short bursts. Smart timers have Cycle and Soak programs we can set up. We will program each zone to run for 2-6 minutes multiple times a day. The time is based off our slope and precipitation rate calculations. As well as how many days per week you’re allowed to water.

For clients on watering restrictions, we have set systems to run up to 7 times per day for no more than 4 minutes at a time. This ensures there is no run off, and more importantly it doesn’t cost any additional money. Often, once the grass starts looking better we can dial the watering back.

(Chart and graph below)

Soil Infiltration Rate Chart - Lawn Sense

Filed Under: Charts - Homeowner Lawn Care & Sprinklers

Irrigation Run Time Chart Instructions

Irrigation performance chart with irrigation run times in minutes vs inches of water neededIrrigation Run Time Chart Instructions

“Inches of water needed” is how much water you want total. If you’re unsure for a particular plant or turf, it can be estimated from your local ET rates from the chart. The PR (precipitation rate) can be acquired from the precipitation rate charts.

For example, assume your plant requirement is. 18 inches per day and your PR rate is 48 inches per hour. Since there is not. 18 inches per day and .48 PR, use the closest figure. In this example, you would use .20 inches per day and .50 PR. Selecting the figure where these two figures intersect gives you 24 minutes per day of run time needed. If your city allowed only three watering days a week, then you would multiply the 24 minutes times 7 days in a week to get 168 minutes of run time for the week. Finally, divide the 168 by 3 days to arrive at 56 minutes of run time three times a week.

Remember, this is a good starting point for water scheduling, however, final adjustments may need to be made (upon observation) to arrive at a more accurate figure.

Filed Under: Charts - Homeowner Lawn Care & Sprinklers

Rotor Head Performance Charts

Rotor Head Performance ChartRotor Head Performance Charts

Rotor heads are a vital component of many irrigation systems, offering adjustable and precise water delivery for large areas. These Rotor Head Performance Charts provide essential information for selecting and configuring rotor heads to ensure an efficient and evenly distributed water application. Properly understanding these charts can help maintain a healthy landscape while minimizing water waste.

How to Use the Rotor Head Performance Chart

  1. Identify the Rotor Head Type:
    The chart categorizes rotor heads into Standard Angle Nozzles and Low Angle Nozzles, each suited for specific irrigation needs. Standard angle nozzles provide a broader radius, while low-angle nozzles are ideal for areas prone to wind drift or requiring closer water delivery.
  2. Determine the Nozzle Size:
    Select a nozzle size based on the radius and flow requirements for your irrigation zone. For example:

    • A #4 Standard Angle Nozzle at 40 PSI offers a 41-foot radius with a flow rate of 4.0 GPM.
    • A #4 Low Angle Nozzle at 40 PSI provides a 35-foot radius with a flow rate of 4.0 GPM.
  3. Check Minimum Operating Pressure:
    The chart specifies a Rotary Head Minimum Head Pressure of 30 PSI to ensure optimal performance. Always verify that your system maintains this minimum pressure.
  4. Match Precipitation Rates:
    Unlike spray heads, rotor heads require manual adjustment to achieve a matched precipitation rate (PR). For example:

    • A 360° rotor head with a 6.0 GPM nozzle will match precipitation if paired with a 3.0 GPM nozzle for 180° heads and a 1.5 GPM nozzle for 90° heads.
    • Use the provided nozzle tree to select the appropriate nozzle sizes.
  5. Calculate Total GPM:
    Multiply the GPM of each rotor head by the total number of heads in the zone. This helps determine the flow capacity required for your irrigation system.
  6. Account for Spacing:
    The spacing between heads should overlap slightly to maintain uniform coverage. Use the radius measurements in the chart to guide placement.

FAQs About Rotor Head Performance Charts

1. What is matched precipitation, and why is it necessary?
Matched precipitation ensures that water is evenly distributed across all areas of your irrigation zone, regardless of the arc of each rotor head. It prevents overwatering or underwatering specific sections of the landscape.

2. How do I know which nozzle size to use?
Choose a nozzle size based on the radius needed for the area being watered and the flow capacity (GPM) of your irrigation system. Refer to the chart for precise flow rates at specific pressures.

3. What is the difference between Standard Angle and Low Angle Nozzles?

  • Standard Angle Nozzles: Provide a higher trajectory and broader coverage, ideal for open areas with minimal wind interference.
  • Low Angle Nozzles: Deliver water at a lower trajectory, reducing wind drift and improving efficiency in windy or constrained spaces.

4. How do I adjust rotor heads for a matched precipitation rate?
Use the nozzle tree provided with the rotor head to install the correct nozzle size for each arc:

  • Full-circle (360°) heads require the highest GPM nozzle.
  • Half-circle (180°) heads use a nozzle with half the GPM of the full-circle head.
  • Quarter-circle (90°) heads use a nozzle with one-quarter the GPM of the full-circle head.

5. Can rotor heads be used on slopes?
Yes, but additional considerations like check valves and pressure regulation may be necessary to prevent runoff or pooling at the base of the slope.

6. How often should I inspect my rotor heads?
Inspect rotor heads monthly during the irrigation season to ensure nozzles are free of debris, arcs are properly adjusted, and precipitation rates are matched.

7. Why is the minimum operating pressure important?
Operating below the specified minimum pressure (30 PSI) can lead to incomplete coverage and inefficient water distribution.

Tips for Optimizing Rotor Head Performance

  • Perform Routine Maintenance: Clean and inspect rotor heads regularly to ensure optimal performance and prevent clogs.
  • Use Manufacturer-Specific Nozzles: Mixing nozzles from different brands can lead to mismatched precipitation rates.
  • Install Pressure Regulators: Consistent pressure ensures uniform water distribution and prevents over-spraying.
  • Account for Wind Conditions: Use low-angle nozzles in windy areas to minimize water drift and improve accuracy.
  • Calculate Precipitation Rate (PR): Use the formula: PR = (96.3 × Total GPM ) / Irrigated Area in Square Feet
    •  This ensures your irrigation schedule aligns with the landscape’s water requirements.

By understanding and applying the information in the Rotor Head Performance Charts, you can achieve a highly efficient irrigation system tailored to your landscape’s specific needs. Proper nozzle selection, matched precipitation rates, and routine maintenance will ensure healthy, lush greenery while conserving water resources.


Filed Under: Charts - Homeowner Lawn Care & Sprinklers

Drip Line Performance Chart

Drip Line Performance Chart – Lawn Sense

The Drip Line Performance Chart is an essential tool for understanding your irrigation system’s water usage and efficiency. By referencing this chart, you can determine the Gallons Per Minute (GPM) or Gallons Per Hour (GPH) your drip line uses based on emitter flow rates, intervals, and row spacing.

Accurate calculations depend on knowing the specifications of your drip line hose and the controlling valve for that zone. Alternatively, measure GPH manually by running the drip zone for an hour and checking your water meter before and after.

Properly assessing your drip line performance helps maintain optimal watering efficiency, supporting healthy plants while conserving water.

Drip Line Performance Chart

How to Use the Drip Line Performance Chart

  1. Determine Emitter Flow Rate: Identify the flow rate of your drip emitters in gallons per hour (GPH). This information is typically printed on the drip line or provided by the manufacturer.
  2. Check Emitter Spacing: Note the interval at which emitters are spaced on the drip line (e.g., 12 inches, 18 inches, or 24 inches). This determines the application rate and distribution of water.
  3. Measure Row Spacing: For agricultural or garden setups, measure the spacing between each row of plants that the drip line irrigates.
  4. Find the Application Rate: Using the chart, locate your emitter flow rate and interval. Match it with the row spacing to determine the total GPM for the zone.
  5. Calculate Total Water Usage: Multiply the GPM for a single line by the number of drip lines in the irrigation zone. This gives you the total GPM for the entire zone.
  6. Verify with a Manual Test: Run the drip zone for one hour and check your water meter before and after. This provides a real-world measurement to confirm the chart calculations.

FAQs About the Drip Line Performance Chart

1. What is the purpose of the drip line performance chart?
The chart helps you calculate the exact water usage of your drip irrigation system, ensuring plants receive adequate water without wastage.

2. Can I use this chart for any type of drip line?
The chart is a general guide and works best when the drip line matches the specified emitter flow rates and spacing. For unique or custom drip lines, refer to the manufacturer’s documentation.

3. What is the difference between GPM and GPH in drip irrigation?

  • GPM (Gallons Per Minute): Used for calculating the total water flow in an irrigation system.
  • GPH (Gallons Per Hour): Represents the output of individual emitters.

To convert GPH to GPM, divide the GPH by 60. For example, a 0.6 GPH emitter delivers 0.01 GPM.

4. How do I identify if my drip line has clogged emitters?
Clogged emitters may cause uneven watering, visible dry spots, or reduced water flow. Perform regular maintenance, such as flushing the system, and use a filter to prevent debris from clogging emitters.

5. How deep should I install drip lines?
Drip lines are generally installed 2 to 6 inches below the soil surface for subsurface irrigation. For surface irrigation, ensure the lines are secured to avoid movement and maximize water efficiency.

6. Can I mix emitters with different flow rates in the same zone?
Mixing emitters with varying flow rates is not recommended, as it disrupts uniform water distribution. If necessary, create separate zones for different flow rates to maintain consistency.

Additional Tips for Drip Line Performance

  • Use Filters and Regulators: Prevent clogs by installing filters and pressure regulators on your system. Clean these components regularly to maintain performance.
  • Consider Soil Type: Sandy soils require closer emitter spacing to prevent water from draining too quickly. Clay soils benefit from wider spacing to avoid water pooling.
  • Account for Slope: On slopes, pressure-compensating emitters ensure even water distribution across the zone.
  • Seasonal Adjustments: Monitor weather conditions and adjust watering schedules during rainy or drought periods to avoid overwatering or underwatering.

By combining the Drip Line Performance Chart with proper installation and maintenance practices, you can create an irrigation system that minimizes water waste and maximizes plant health. For more advanced calculations or system-specific concerns, call us here at Lawn Sense.

Filed Under: Charts - Homeowner Lawn Care & Sprinklers

Your Name(Required)
Services Interested In(Required)

Copyright © 2025 Lawn Sense | License #LI0026000 | Privacy Policy